nuScenes
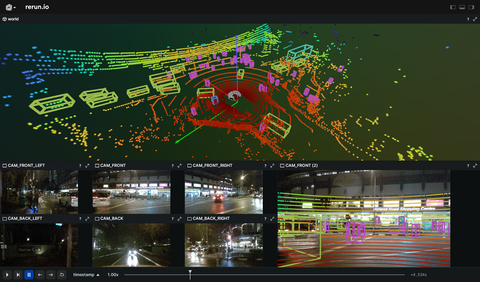
Visualize the nuScenes dataset including lidar, radar, images, and bounding boxes data.
Used Rerun types used-rerun-types
Transform3D, Points3D, Boxes3D, Pinhole, ImageEncoded
Background background
This example demonstrates the ability to read and visualize scenes from the nuScenes dataset, which is a public large-scale dataset specifically designed for autonomous driving. The scenes in this dataset encompass data collected from a comprehensive suite of sensors on autonomous vehicles. These include 6 cameras, 1 LIDAR, 5 RADAR, GPS and IMU sensors. Consequently, the dataset provides information about the vehicle's pose, the images captured, the recorded sensor data and the results of object detection at any given moment.
Logging and visualizing with Rerun logging-and-visualizing-with-rerun
The visualizations in this example were created with the following Rerun code:
Sensor calibration sensor-calibration
First, pinhole cameras and sensor poses are initialized to offer a 3D view and camera perspective. This is achieved using the Pinhole and Transform3D archetypes.
rr.log(
    f"world/ego_vehicle/{sensor_name}",
    rr.Transform3D(
        translation=calibrated_sensor["translation"],
        rotation=rr.Quaternion(xyzw=rotation_xyzw),
        from_parent=False,
    ),
    timeless=True,
)rr.log(
f"world/ego_vehicle/{sensor_name}",
rr.Pinhole(
image_from_camera=calibrated_sensor["camera_intrinsic"],
width=sample_data["width"],
height=sample_data["height"],
),
timeless=True,
)Timelines timelines
All data logged using Rerun in the following sections is initially connected to a specific time.
Rerun assigns a timestamp to each piece of logged data, and these timestamps are associated with timelines.
rr.set_time_seconds("timestamp", sample_data["timestamp"] * 1e-6)Vehicle pose vehicle-pose
As the vehicle is moving, its pose needs to be updated. Consequently, the positions of pinhole cameras and sensors must also be adjusted using Transform3D.
rr.log(
    "world/ego_vehicle",
    rr.Transform3D(
        translation=ego_pose["translation"],
        rotation=rr.Quaternion(xyzw=rotation_xyzw),
        from_parent=False,
    ),
)
LiDAR data lidar-data
LiDAR data is logged as Points3D archetype.
rr.log(f"world/ego_vehicle/{sensor_name}", rr.Points3D(points, colors=point_colors))Camera data camera-data
Camera data is logged as encoded images using ImageEncoded.
rr.log(f"world/ego_vehicle/{sensor_name}", rr.ImageEncoded(path=data_file_path))Radar data radar-data
Radar data is logged similar to LiDAR data, as Points3D.
rr.log(f"world/ego_vehicle/{sensor_name}", rr.Points3D(points, colors=point_colors))Annotations annotations
Annotations are logged as Boxes3D, containing details such as object positions, sizes, and rotation.
rr.log(
    "world/anns",
    rr.Boxes3D(
        sizes=sizes,
        centers=centers,
        rotations=rotations,
        class_ids=class_ids,
        fill_mode=rr.components.FillMode.Solid,
    ),
)
Setting up the default blueprint setting-up-the-default-blueprint
The default blueprint for this example is created by the following code:
sensor_space_views = [
    rrb.Spatial2DView(
        name=sensor_name,
        origin=f"world/ego_vehicle/{sensor_name}",
    )
    for sensor_name in nuscene_sensor_names(nusc, args.scene_name)
]
blueprint = rrb.Vertical(
    rrb.Spatial3DView(name="3D", origin="world"),
    rrb.Grid(*sensor_space_views),
    row_shares=[3, 2],
)
We programmatically create one view per sensor and arrange them in a grid layout, which is convenient when the number of views can significantly vary from dataset to dataset. This code also showcases the row_shares argument for vertical containers: it can be used to assign a relative size to each of the container's children. A similar column_shares argument exists for horizontal containers, while grid containers accept both.
Run the code run-the-code
To run this example, make sure you have Python version at least 3.9, the Rerun repository checked out and the latest SDK installed:
pip install --upgrade rerun-sdk  # install the latest Rerun SDK
git clone git@github.com:rerun-io/rerun.git  # Clone the repository
cd rerun
git checkout latest  # Check out the commit matching the latest SDK release
Install the necessary libraries specified in the requirements file:
pip install -e examples/python/nuscenes_datasetTo experiment with the provided example, simply execute the main Python script:
python -m nuscenes # run the exampleIf you wish to customize it, explore additional features, or save it use the CLI with the --help option for guidance:
python -m nuscenes --help